[feature] Add Task Explorer

The Task Explorer lets the user see all the jobs, processes, and threads
running in the system. The user can also use this view to attach to a
process.

Fixed: b/374109093
Change-Id: Id11bc474a4454dd1f8aba4147787feb9d2938d1e
Reviewed-on: https://fuchsia-review.googlesource.com/c/vscode-plugins/+/1141132
Kokoro: Kokoro <noreply+kokoro@google.com>
Reviewed-by: Amy Hu <amyhu@google.com>
Implements the commonly needed functionality for Fuchsia development.
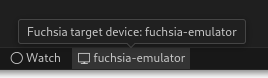
Select a Fuchsia device using the Device Selector in the bottom toolbar:
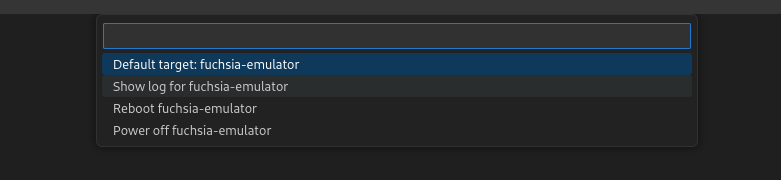
Select “Show log for device name” from quick picker:
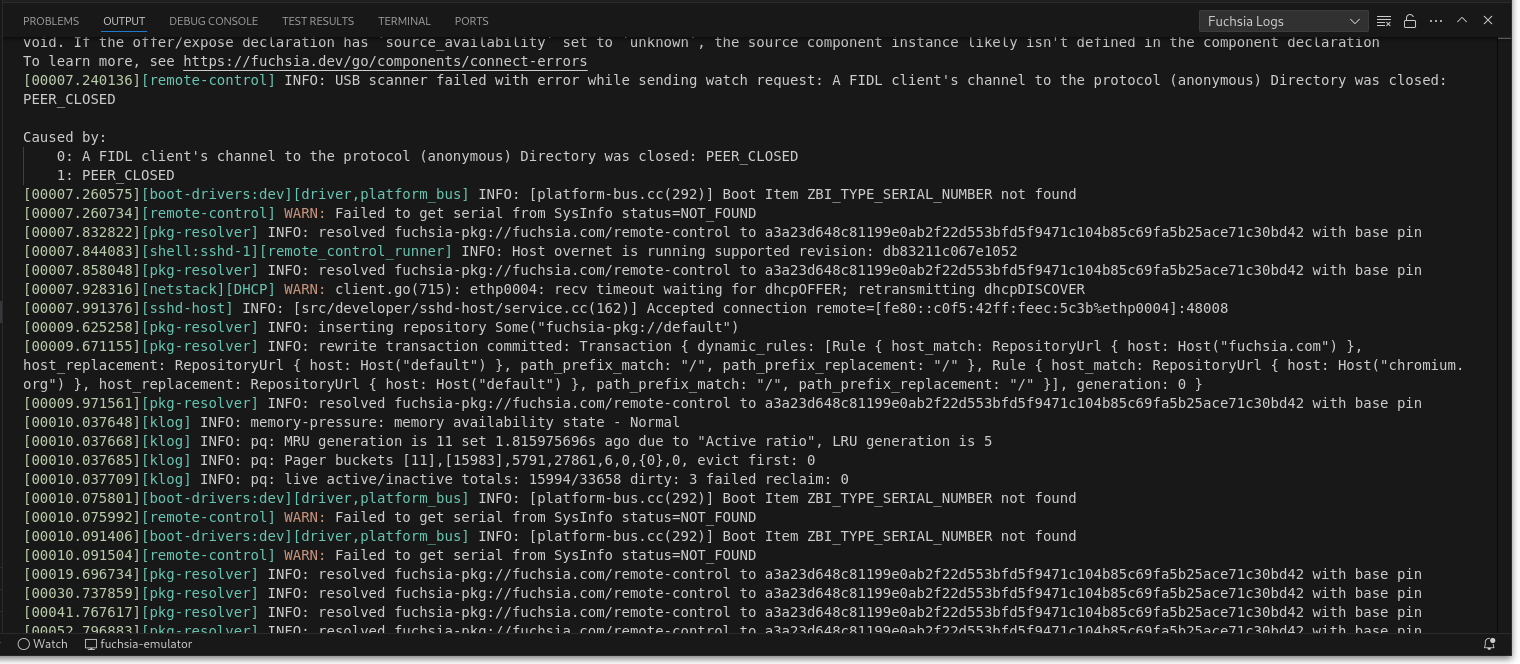
View the logs:
Select the “Testing” tab from the left navigation bar and view the list of tests in your current build configuration:
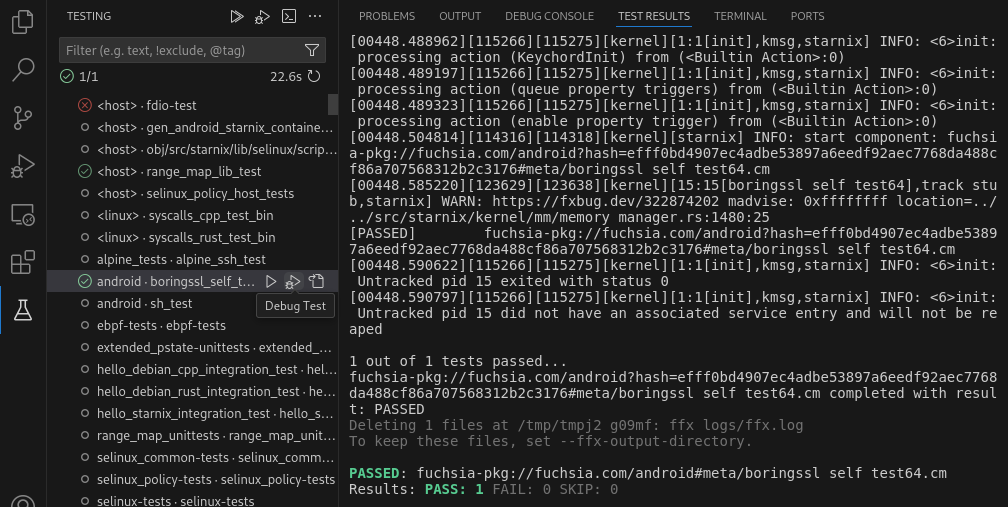
Click the “Run Test” or “Debug Test” button to run or debug the test. Double-click the test to jump to the BUILD.gn that defines the test.
Select the “Run and Debug” tab from the left navigtaion bar and expand the “Fuchsia Components” panel to view the components running on the device:
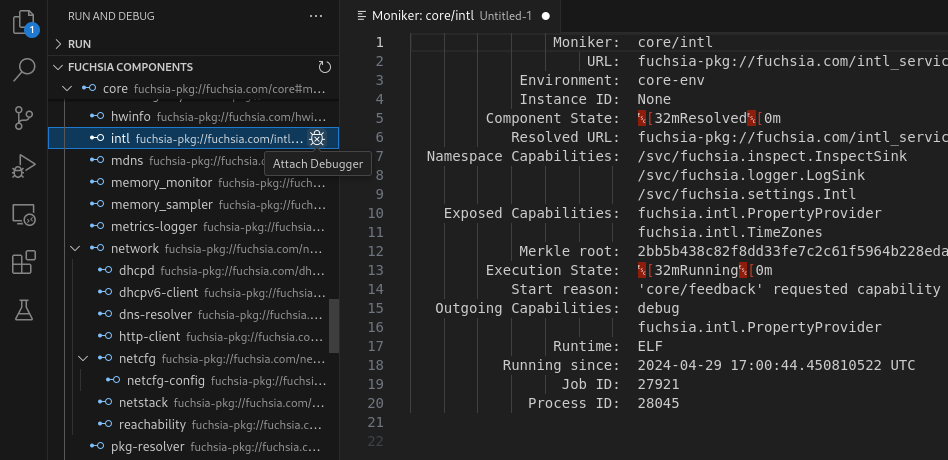
Click the “Attach Debugger” button to attach the debugger to the component. Set a breakpoint by clicking to the left of a line of source code to stop the component on that line of code.
Click a component to show more information about that component.
The FFX tool path can be set under Settings > Extensions > Fuchsia SDK. If this path is not set, the extension will automatically search for it at:
./tools/ffx./.jiri_root/bin/ffxUse of the Fuchsia core developer tools is subject to the Google Terms of Service. The Google Privacy Policy describes how data is handled in your use of this service.