Fuchsia VS Code Extension
The Fuchsia VS Code Extension streamlines Fuchsia development by integrating essential tools and workflows within the editor.
Visit the fuchsia.dev reference for a detailed walkthrough of this extension's features, Using the Fuchsia extension for VS Code.
Setup
Ensure you have a Fuchsia source checkout. You may need to configure the path to your ffx tool:
- Go to
Settings > Extensions > Fuchsia - Set the
Fuchsia: Ffx Path to the absolute path of your ffx executable.
If not set, the extension will search for ffx in ./tools/ffx and ./.jiri_root/bin/ffx.
Features
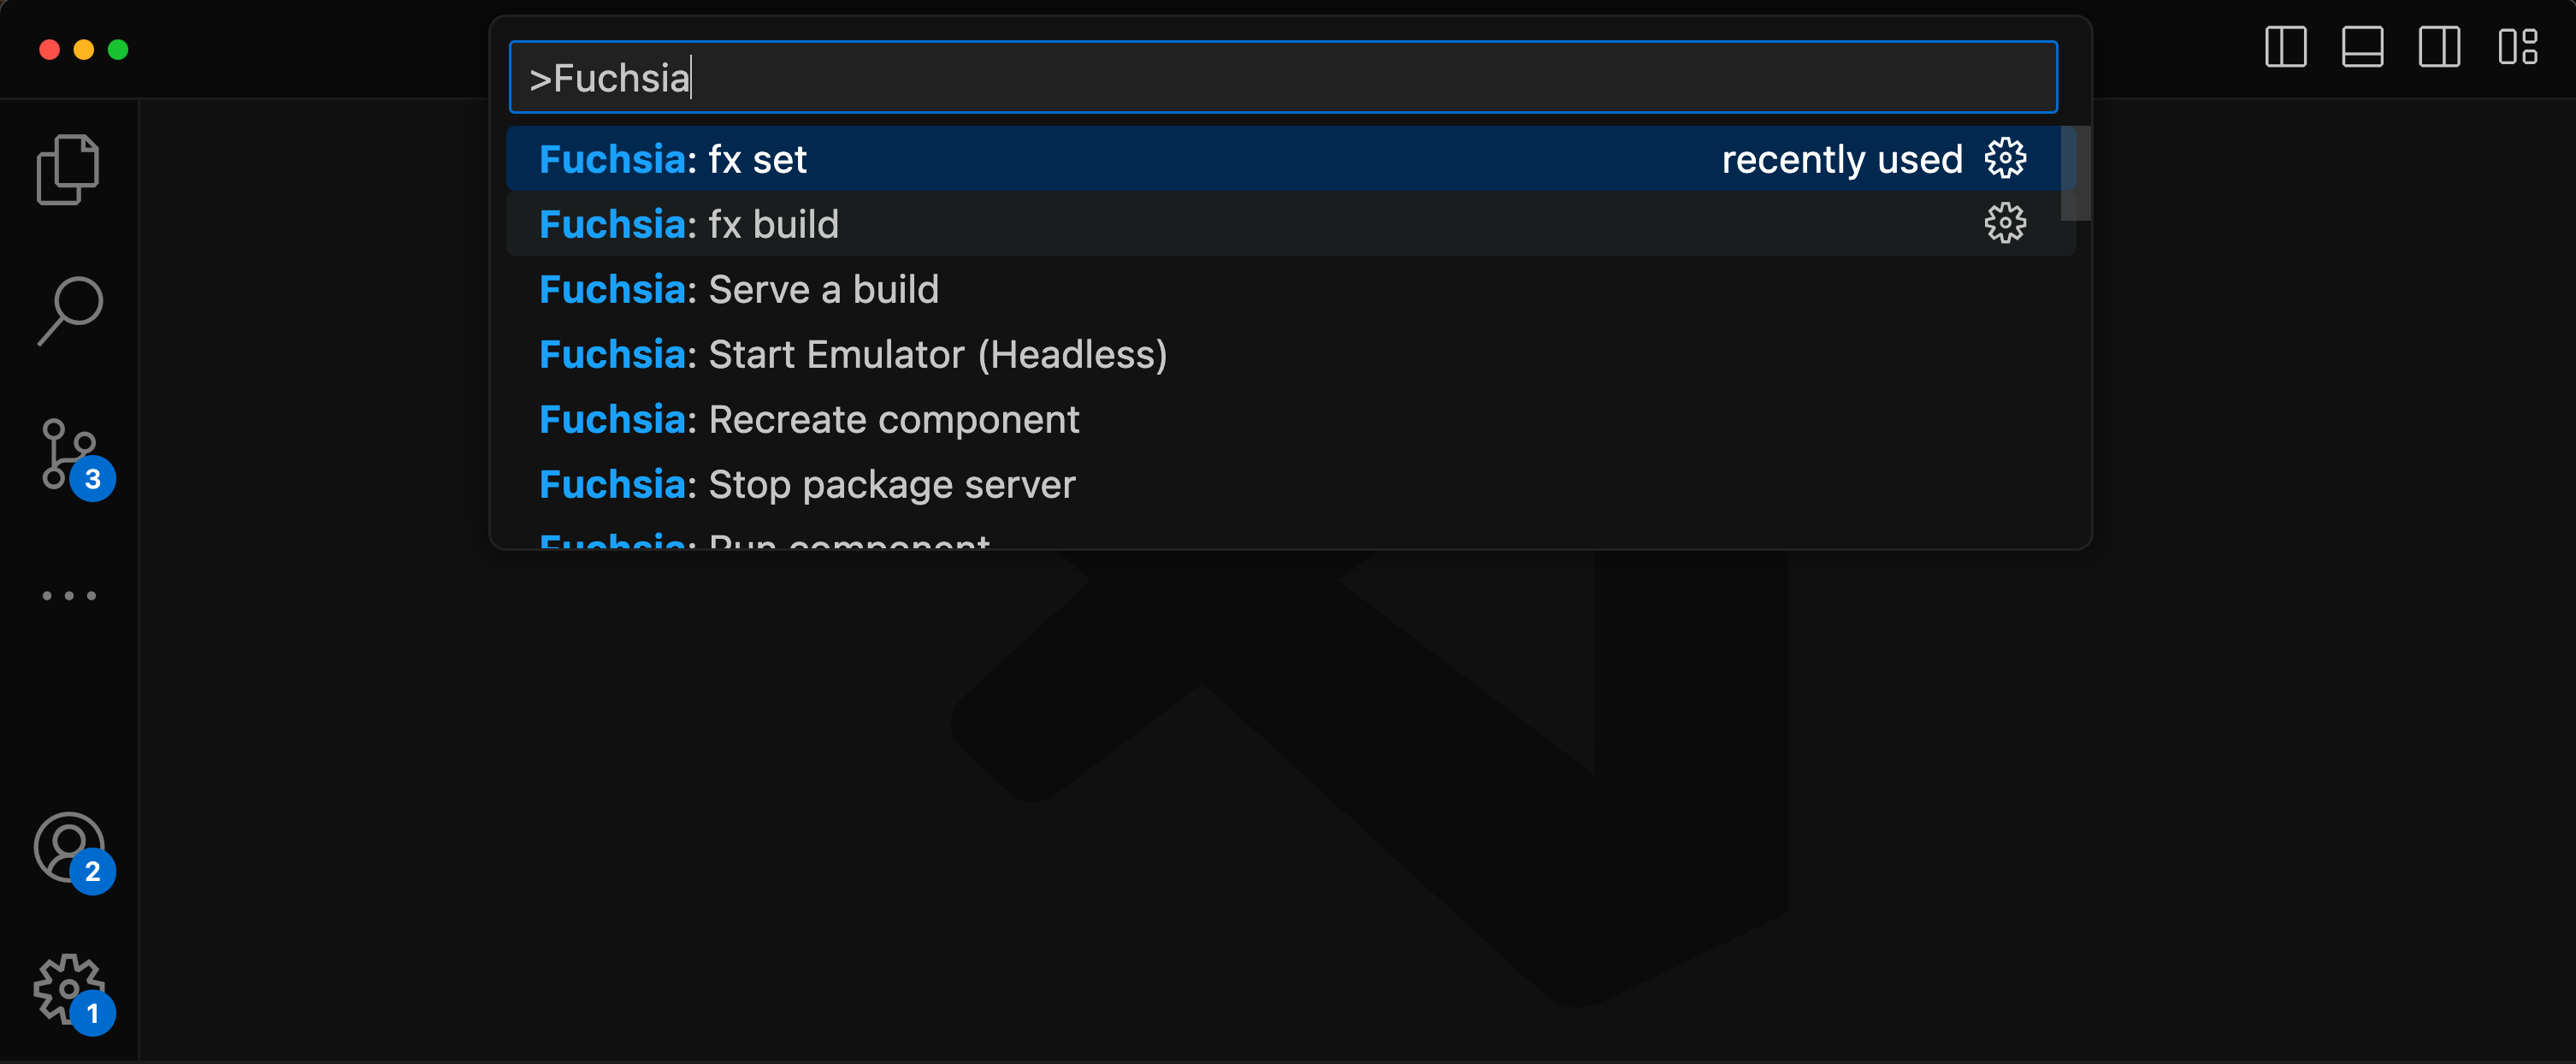
All features are accessible via the VS Code command palette Ctrl+Shift+P or Cmd+Shift+P. Type “Fuchsia” to see a list of available commands.
Configure and run builds
- fx set: Interactively select product, board, compilation mode, and packages.
- fx build: Run builds, monitor progress and output in VS Code.
- fx serve: Start and stop the package server.
- fx ota: Trigger an over-the-air update.
Target management
- Target discovery: List and switch between connected Fuchsia targets.
- Target interaction: Reboot, power off, or capture a snapshot of a connected device.
- Emulator control: Start and stop the Fuchsia emulator (ffx emu).
- Log viewer: Stream logs to dedicated output channel.
Debug & test
- Test explorer: Run and debug tests within the VS Code UI.
- Component explorer: View and manage component list.
- ZXDB debugger: Attach the zxdb debugger to running processes or components.
Language support
- Syntax highlighting: For FIDL and Component Manifest (CML) files.
- Build output links: Makes file paths in build logs clickable to jump directly to the source code.
- Problem matcher: Parses build output to show C++ and Rust errors in the “Problems” panel.
Tips
Keybinds for fx build
There are two options to set a keybinds for fx build.
Default build task
- Open the command palette.
- Select
Terminal > Configure Default Build Task... - Select
Fuchsia Extension: fx build - The command can be run with Cmd+Shift+b or Ctrl+Shift+b.
Custom key
- Open
Preferences: Open Keyboard Shortcuts - Search for
Fuchsia: fx build - Double click keybinding cell and set desired keybind.
Recommended extensions
Contributing
Issues/feedback
- Please report issues/feedback here.
Legal Notice
Use of the Fuchsia core developer tools is subject to the Google Terms of Service. The Google Privacy Policy describes how data is handled in your use of this service.