Debugging vs Code plugin and the Language Server
Install LLDB and the LLDB Extension.
Checkout rust rust-analyzer and open it in vscode.
$ git clone https://github.com/rust-analyzer/rust-analyzer.git --depth 1
$ cd rust-analyzer
$ code .
To attach to the
lsp serverin linux you'll have to run:echo 0 | sudo tee /proc/sys/kernel/yama/ptrace_scopeThis enables ptrace on non forked processes
Ensure the dependencies for the extension are installed, run the
npm: install - editors/codetask in vscode.Launch the
Debug Extension, this will build the extension and thelsp server.A new instance of vscode with
[Extension Development Host]in the title.Don't worry about disabling
rlsall other extensions will be disabled but this one.In the new vscode instance open a rust project, and navigate to a rust file
In the original vscode start an additional debug session (the three periods in the launch) and select
Debug Lsp Server.A list of running processes should appear select the
ra_lsp_serverfrom this repo.Navigate to
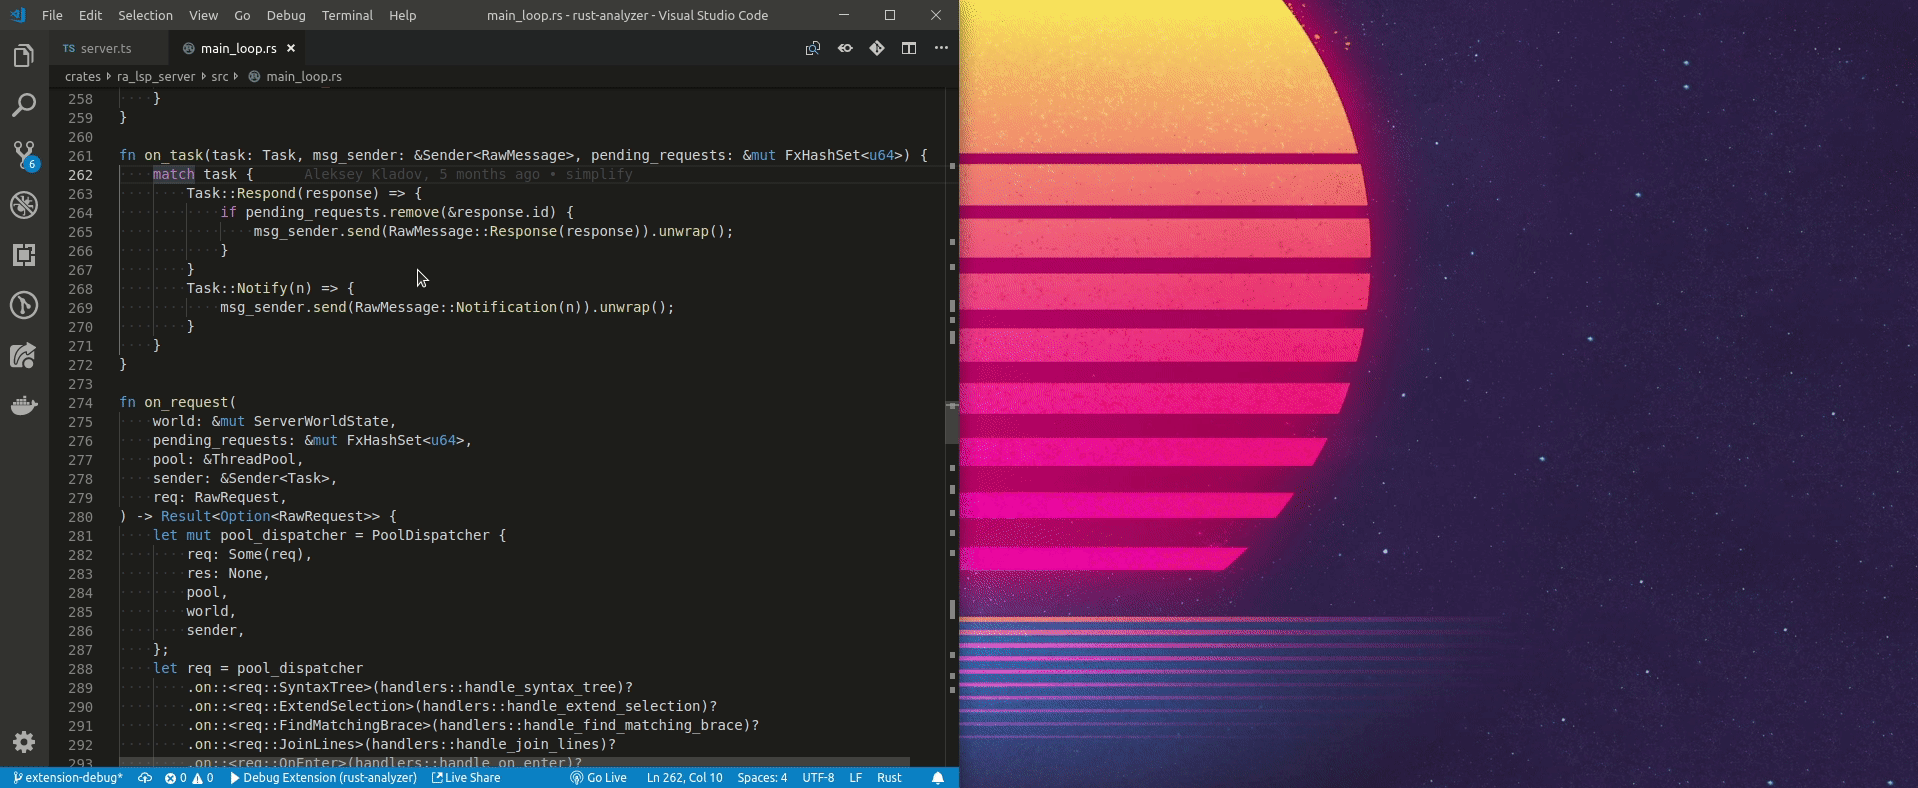
crates/ra_lsp_server/src/main_loop.rsand add a breakpoint to theon_taskfunction.Go back to the
[Extension Development Host]instance and hover over a rust variable and your breakpoint should hit.
Demo
Troubleshooting
Can't find the ra_lsp_server process
It could be a case of just jumping the gun.
The ra_lsp_server is only started once the onLanguage:rust activation.
Make sure you open a rust file in the [Extension Development Host] and try again.
Can't connect to ra_lsp_server
Make sure you have run echo 0 | sudo tee /proc/sys/kernel/yama/ptrace_scope.
By default this should reset back to 1 everytime you log in.
Breakpoints are never being hit
Check your version of lldb if it‘s version 6 and lower use the classic adapter type. It’s lldb.adapterType in settings file.
If you're running lldb version 7 change the lldb adapter type to bundled or native.